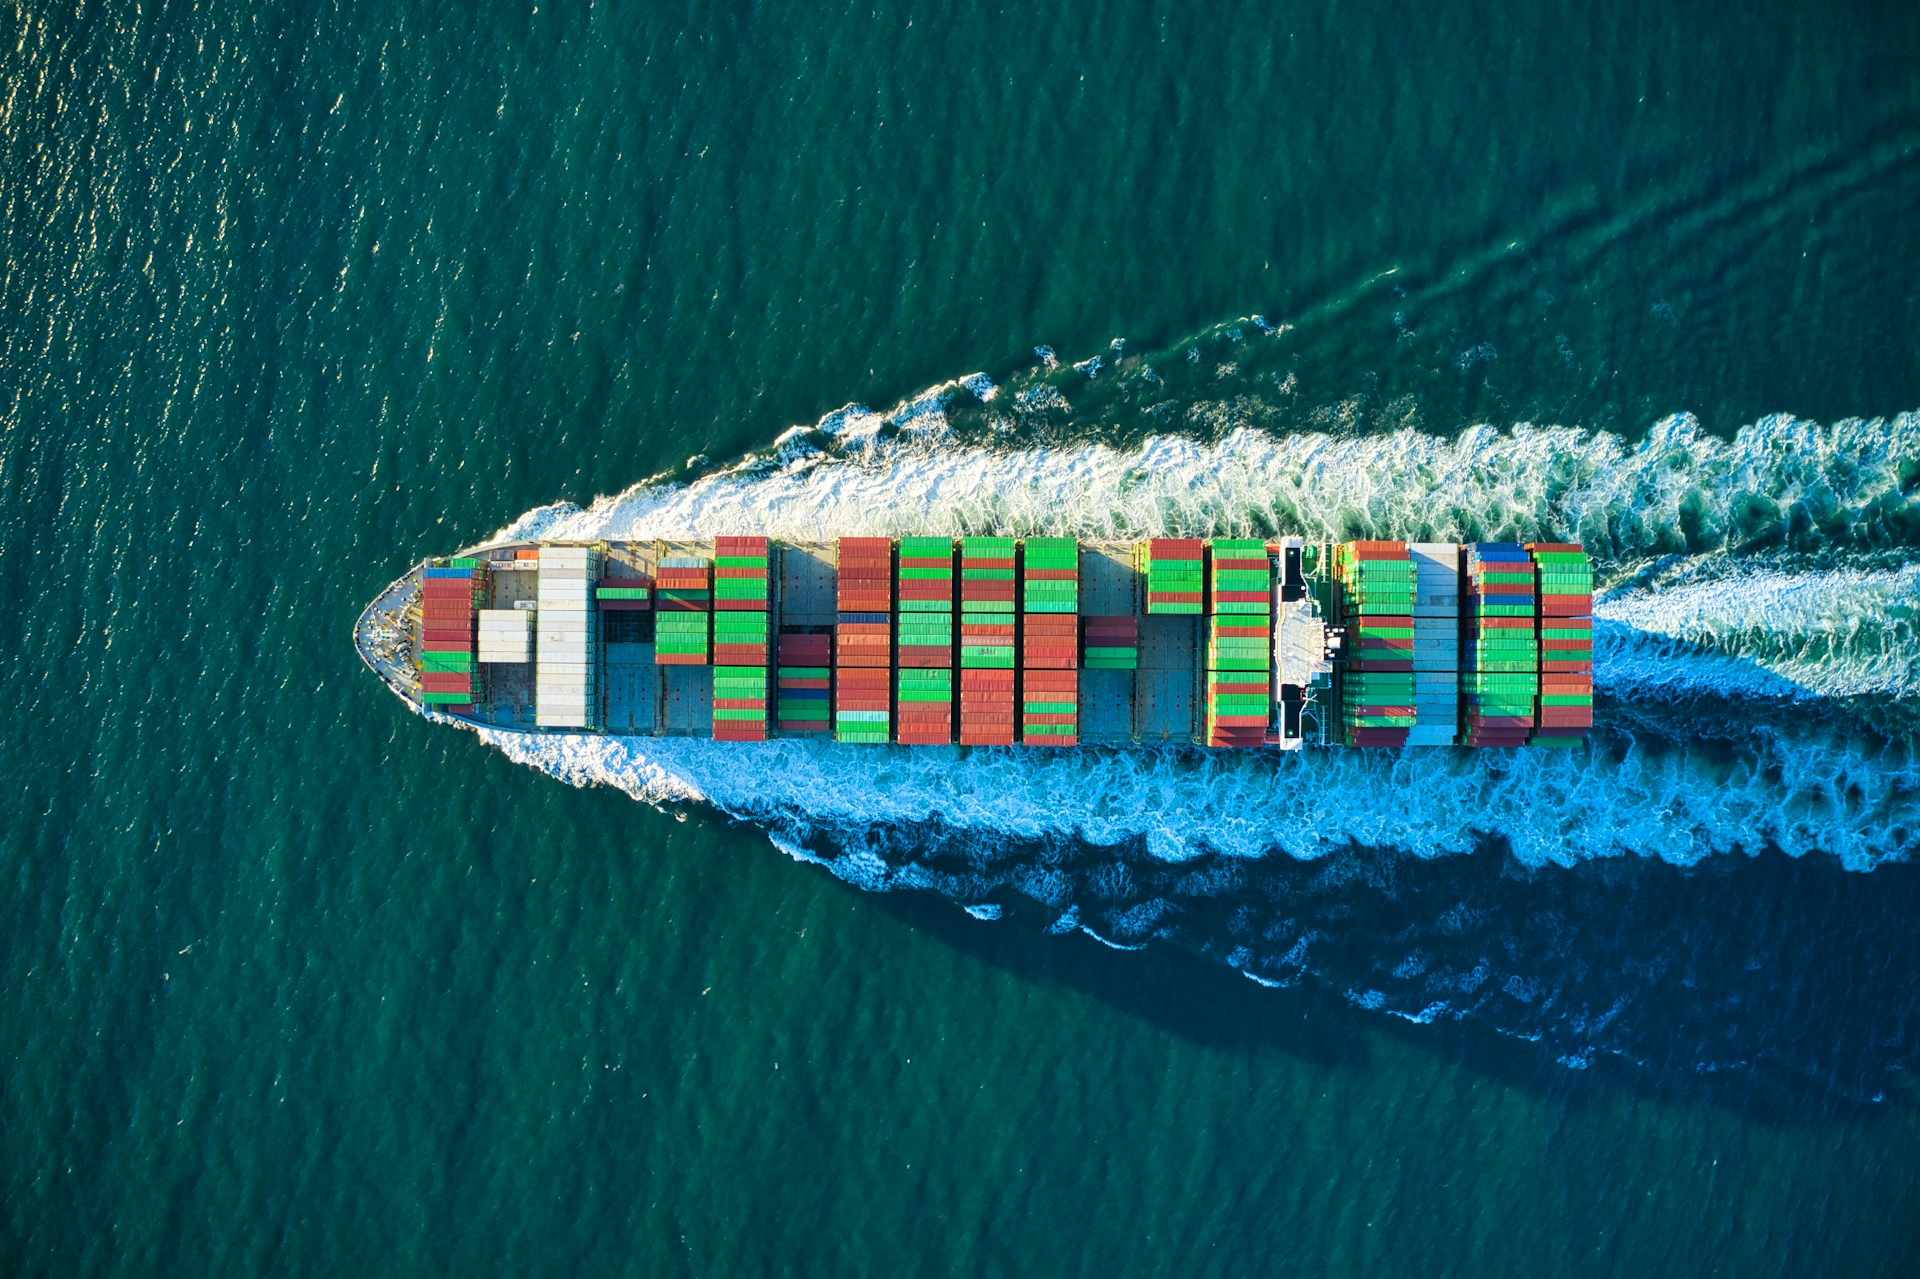
A new probabilistic model reveals where and when rogue waves are most likely to strike and why the Torres Strait is a hotspot. Photo credit: Venti Views via Unsplash.
Imagine a wall of water twice the height of surrounding waves appearing without warning in front of a cargo vessel. Although such rogue waves are rare, they have damaged ships, injured crews, and challenged long-held assumptions about ocean behaviour.
Cargo ships transport around 90% of world trade—they keep the global economy moving. If there are issues with shipping routes, there would be global shortages of raw materials, agricultural products, and many other resources. Recent disruptions in major maritime chokepoints such as the Strait of Hormuz have highlighted how vulnerable global supply chains can be due to interruptions in shipping routes. Shipping routes are carefully planned using factors such as weather, fuel efficiency, water depth, and safety, but one of the most difficult hazards to account for is the risk of rogue waves.
Rogue waves are defined as waves at least twice the significant wave height (average height of the tallest third of waves).
Rogue waves are defined as waves at least twice the significant wave height (average height of the tallest third of waves). Although rare, they can damage vessels, individuals, cargo, and offshore infrastructure. Unlike storm waves, they cannot be reliably forecast. Instead, their likelihood can be estimated by modelling ocean conditions such as wave height, currents, and the topography of the ocean floor.
How can we predict something that is so unpredictable?
Rogue waves are difficult to predict because they arise from a complex combination of ocean conditions. To tackle this challenge, we built a computer model that estimates the probability of rogue waves forming in a certain location, using data provided by Amentum Scientific.
To check that our model was reliable, we compared its predictions with two well-trusted sources. The established Tayfun-Forristall model and real measurements of ocean waves collected by the California Coastal Data Information Program. Our results closely matched both, giving us confidence that the model provides realistic estimates of the risk.
Having established confidence in the model, we then used it to estimate how rogue wave risk varied throughout 2025. We applied it to the Torres Strait to investigate how rogue wave risk varies across one of Australia’s most important shipping corridors. As more ocean data becomes available and computing methods improve, this approach could help provide seasonal forecasts, allowing ships to take the best route to avoid rogue waves.
A local case study:— Torres Strait
The Torres Strait is a significant trade route…filled with many small coral islands, inhabited by native Torres Strait Islanders, making it a key region for biodiversity and culture.
The Torres Strait is a significant trade route along the northern coast of Australia. It is 150km wide and is the region between Australia’s Cape York Peninsula and Papua New Guinea. The region is filled with many small coral islands, inhabited by native Torres Strait Islanders, making it a key region for biodiversity and culture. Every year, around 3,000 cargo ships traverse this strait as it connects the Indian and Pacific Oceans. Thousands of smaller vessels also operate throughout the region, providing essential transport links and resources to island communities.
Its shallow waters, with an average depth of 15m, combined with strong tidal currents and persistent wind systems, create conditions that concentrate wave energy and may increase the likelihood of rogue wave formation compared with many open-ocean environments. The narrow channels between islands cause wave diffraction around coral islands and interactions between currents, increasing the chance of unusually large waves forming.
The consequences of rogue waves are not purely theoretical. In 2022, a small vessel operating in the Torres Strait capsized during rough sea conditions. The operator survived, but the incident illustrates how vulnerable smaller vessels are to unexpectedly large waves. Many Torres Strait Island communities depend on marine transport for food, fuel, medical supplies, and economic activity. As a result, understanding rogue wave risk has implications not only for international shipping but also for the safety and resilience of local communities.
Even rare events become more significant when thousands of vessels pass through each year, particularly smaller boats that are more vulnerable to unusually large waves.
The region’s high shipping traffic also increases the overall risk. Even rare events become more significant when thousands of vessels pass through each year, particularly smaller boats that are more vulnerable to unusually large waves. Seasonal weather patterns, including the monsoon and El Niño–Southern Oscillation (ENSO), may also influence rogue wave risk, making the Torres Strait an ideal region to study.
Using data from Amentum Scientific, we applied our model to this system. We produced a heat map of the risk of rogue waves, illustrating the riskier areas for ships to sail through at different times of the year. Below are the heat maps for 7 August 2025 (above) and 14 April 2025 (below), where the colours show relative risk rather than the absolute probability of occurrence.


One of the clearest findings was that rogue wave risk is not uniform. Instead, hotspots emerged within the Torres Strait, with their location and intensity changing throughout the year. This suggests that both route choice and season influence a vessel’s exposure.
Why is this significant—insurance & implications
Understanding rogue wave risk has direct implications for maritime insurance and operational planning. Insurers will use probability-based risk assessments to determine the premiums, and regions with increased chances of rogue waves may result in higher insurance premiums for the shipping companies, potentially influencing the routes they choose. Improving the spatial resolution of these models will make future risk estimates even more accurate. The safest route for cargo vessels to avoid rogue waves can vary by season, and so modelling this is incredibly important. Incorporating past data into navigation can improve safety margins and reduce the chance of catastrophic losses. On a broader scale, improved risk assessment contributes to supply chain resilience by minimising unexpected disruptions in key global trade routes.
As rogue wave models improve, they may eventually be incorporated into voyage-planning software, allowing operators to dynamically adjust routes based on changing ocean conditions. This could reduce exposure to extreme events while improving fuel efficiency and operational safety.
The Torres Strait study highlights how regional conditions can elevate rogue wave risk, even along well-established shipping routes.
Rogue waves may always be rare, but they may not remain completely unpredictable. By combining oceanographic data (provided by Amentum Scientific) with probabilistic models, researchers can identify where conditions favour their formation, helping ships to navigate more safely. The Torres Strait study highlights how regional conditions can elevate rogue wave risk, even along well-established shipping routes. As global trade continues to depend on maritime transport, understanding these rare events will become increasingly important for building safer and more resilient shipping networks.
Written by Jemima Dinsley and codeveloped by George Davies and Parv Choudhary
This article was created as part of a micro-internship with Amentum Scientific via the Oxford University Careers Service.
Edited by Mia Clark-Webb, Sebastian Evans, and An-Nhi Huynh.