Hannah Glendell, Year 12, Cults Academy, Aberdeen
We live in a world of data. Every day numbers are thrown at us from all directions: teenagers have anxiety, people will get cancer, people have died of Coronavirus. But says who? Numbers swirl around us; wildly exaggerated, spreading like Chinese whispers. The pandemic has exacerbated this problem. Many newspapers have used headlines that ‘make a good story’. But this spreads misinformation. People live in a distorted reality of what others want them to think because statistics have been manipulated to make them believe something. This is dangerous. It prevents people from making informed decisions and can undermine democracy. Yet there is a solution to this: whenever we are presented with statistics we must ask, ‘what do these numbers actually mean’?
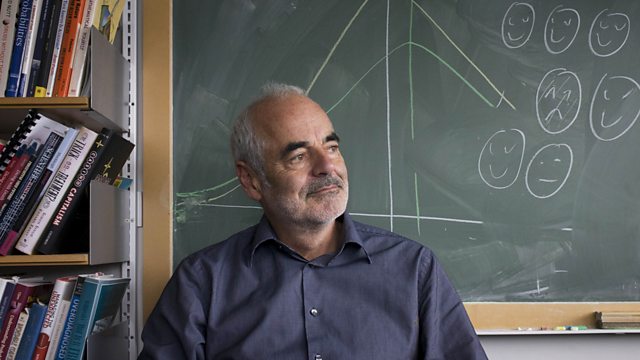
This is what David Spiegelhalter, British statistician and Winton Professor of the Public Understanding of Risk at Cambridge University, encourages. Take, for example, bacon sandwiches. The Daily Record published in 2015 that ‘Bacon, Ham and Sausages have the Same Cancer Risk as Cigarettes Warn Experts’, claiming that eating bacon every day gave you an 18% increased risk of bowel cancer. Should we be worried? Spiegelhalter answered this question with simple statistics.
He looked at the number of ‘ordinary’ people that would develop bowel cancer and compared it to a group that ate bacon every day. He found that 6% of ‘ordinary’ people would develop bowel cancer, compared to 7% of those eating bacon. Clearly, the journalists had interpreted the relative risk increase of 18% (6 x 1.18 = 7.08) as the increase in absolute risk, making it sound like eating bacon every day made you 18% more likely to develop bowel cancer. Spiegelhalter showed that in reality, the difference was just 1%, which as he said himself, was not enough to stop him eating bacon ever again.
This is just one example where Spiegelhalter helped the public to understand risk. Recently, he compared the risk of catching and dying from Covid-19 to the ‘normal’ risk of dying. He found that over 16 weeks of the pandemic, the risk of catching and dying from Covid-19 was roughly the same as the risk of dying during a 16 week period from any other cause. The graph is exponential, so the risk of catching and dying from Covid-19 increases with age. Since this risk is roughly the same as dying from any other cause, by adding the two together you effectively double the risk of dying this year. The risk starts off negligible, so for anyone under 20, although their risk of death is doubled, it is still incredibly small. Through effective communication, Spiegelhalter has provided the public with a simple analogy to understand the risk that the virus poses. He is not only educating the public on how to make informed decisions but, also helps the Government devise effective policies. For example, his research shows that opening schools is not dangerous in terms of children dying.
As with any statistical analysis, this interpretation has limitations. It does not account for long-term impacts that the survivors may face, or the increased risk of a pre-existing medical condition. Spiegelhalter is aware of this and makes it clear whenever he communicates his findings. Good communication starts with statisticians, but the public must also question data. Spiegelhalter is showing people how to do this, how by being able to think for ourselves and question what we are told, we can demand responsible use of statistics from the media. He encourages us to ask: Are the numbers trustworthy? How are the numbers framed? What am I not being told, and why?
David Spiegelhalter goes further than the average statistician. He is determined to communicate numbers in a meaningful way. His findings about the risk of Covid-19 were important, but even more important was how he presented the statistics in a way that everyone could understand. In a world full of data and misinformation, Spiegelhalter is spearheading good communication to help governments and individuals make informed decisions. As we progress through this pandemic and beyond to solve global issues such as climate change and food security, it is imperative that statistics are effectively communicated. How else can we tackle these big questions, unless we are correctly informed?
Runner-up for the Schools Science Writing Competition, Michaelmas Term, 2020
Image credit: bbc.co.uk


